VSCode Resource Leak Disrupts SSH Tunnel and Gradio Subprocess for User
A developer, known as Birchlabs on social media, recently reported a significant resource leak within Visual Studio Code (VSCode) that severely impacted their workflow. The issue escalated to the point where a 1.6MB JPG upload to a Gradio subprocess, operating over VSCode's SSH tunnel, failed after 45 seconds due to excessive resource consumption. A simple restart of the VSCode application reportedly resolved the immediate problem.
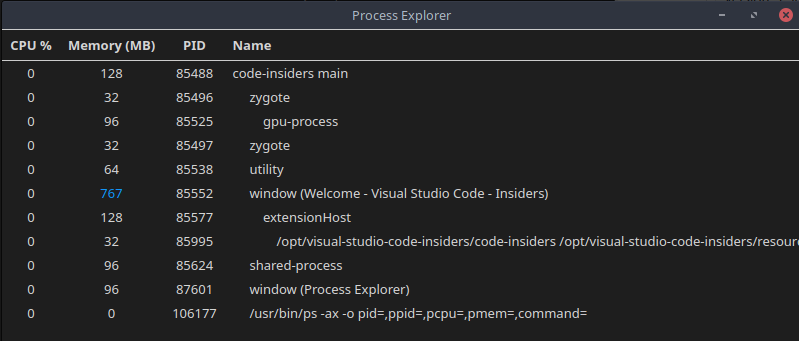
"okay yeah it was just VSCode leaking resources like crazy (again). got so bad that uploading a 1.6MB jpg to VSCode's gradio subprocess over VSCode's ssh tunnel failed after 45 secs. restarting VSCode fixed everything," Birchlabs stated in the tweet.
This incident highlights a recurring concern among users regarding VSCode's memory management, particularly when dealing with remote development environments and integrated tools. User complaints and GitHub issues frequently cite "freeze-slow-crash-leak" problems, with some reports indicating high memory usage specifically when remote SSH folders are pinned or multiple vscode-server instances are running.
The integration of web-based machine learning interfaces like Gradio within development environments is becoming increasingly common. However, such setups can exacerbate existing resource management challenges, especially when combined with the overhead of SSH tunneling. The reported failure to upload a relatively small file suggests a substantial bottleneck caused by the resource leak.
While a quick restart often provides a temporary fix, the persistent nature of these memory issues points to underlying complexities within the Electron-based architecture of VSCode or its extensive ecosystem of extensions. Developers frequently discuss the impact of extensions on memory footprint, and some official issues on the VSCode GitHub repository acknowledge ongoing investigations into memory consumption. The incident underscores the continuous effort required to optimize modern development tools for diverse and demanding use cases.