Piotroski F-Score Demonstrates 13.4% Annual Outperformance in Stock Selection
A widely recognized stock selection strategy, the Piotroski F-Score, has consistently shown significant outperformance, with historical data indicating an average annual return 13.4% better than the market over a two-decade period. The method, developed by Stanford University Professor Joseph Piotroski, assesses a company's financial health using a nine-point scoring system to identify fundamentally strong value stocks.
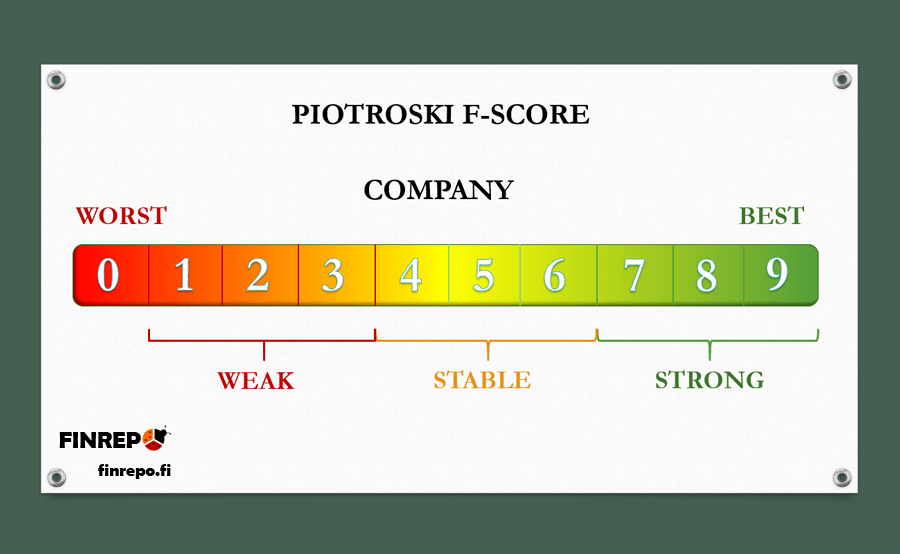
The Piotroski F-Score, ranging from 0 to 9, evaluates a company's financial health using a nine-point scoring system to identify fundamentally strong value stocks. Each of nine criteria, such as positive net income, increasing return on assets, and lower debt, earns one point, with scores of 8 or 9 indicating robust financial health. This systematic approach aims to distinguish "winners from losers" among companies, particularly those with low price-to-book ratios.
Historically, the strategy has yielded impressive results. Between 1976 and 1996, investing in companies with the highest F-Scores (8 or 9) led to a 13.4% average yearly outperformance. Even more notably, a strategy combining long positions in high F-score companies and short positions in low F-score companies (0 or 1) generated an average annual return 23% better than the market during the same period.
While the F-Score has proven effective for identifying strong companies and can enhance returns for growth stocks, its performance has shown some decay in recent years as the strategy becomes more widely adopted. Experts suggest that while it remains a powerful tool, it should be integrated into a broader investment strategy and complemented with ongoing market analysis. The original research paper, "Value Investing: The Use of Historical Financial Statement Information to Separate Winners from Losers," underpins this enduring investment approach.